

This article demonstrates how to evaluate and compare classifiers using ROC curves and AUC in R for financial analysis, ensuring that model selection aligns with both predictive performance and the economic costs of misclassification.
Article Outline
Introduction
Why classifier evaluation matters in finance: risk scoring, credit approval, fraud detection, and compliance.
Why accuracy alone can be misleading when data are imbalanced and misclassification costs are asymmetric.
Understanding ROC Curves
Defining True Positive Rate (Sensitivity/Recall) and False Positive Rate (1–Specificity).
How varying thresholds create the ROC curve.
Interpreting the random baseline versus the ideal top-left corner.
Area Under the Curve (AUC)
AUC as a threshold-independent metric for model discrimination.
Interpretation of AUC values in financial contexts (acceptable, strong, or poor models).
Why AUC is often favored by model risk management committees.
Economic Costs and Thresholds
Mapping false positives and false negatives to financial costs: lost revenue, defaults, reputational damage.
Business implications of threshold selection and how ROC analysis informs these choices.
R Environment Setup
Packages required:
tidyversefor data wrangling/plotting,caretfor modeling,pROCfor ROC/AUC,rangerfor Random Forest,e1071for SVM.Why R is widely adopted in risk and compliance analytics.
Data Preparation for a Financial Problem
Simulating borrower or transaction data.
Train-test split and ensuring class balance checks.
Avoiding data leakage in financial datasets.
Training Classifiers in R
Logistic Regression as a transparent baseline model.
Random Forest for nonlinear patterns in borrower or transaction data.
Support Vector Machine for robust classification with complex decision boundaries.
Building and Plotting ROC Curves
Extracting predicted probabilities.
Generating ROC curves and AUC values with
pROC.Plotting multiple ROC curves for direct comparison.
Comparing Models with AUC and Statistical Tests
Using AUC values to rank classifiers.
Applying DeLong’s test to statistically compare AUCs.
Understanding when curves overlap and why economic context matters more than raw AUC.
Selecting Operating Thresholds
Using Youden’s J statistic to find optimal thresholds.
Translating chosen thresholds into confusion matrices.
Linking results to financial KPIs such as expected default rates or fraud detection rates.
Robust Validation and Best Practices
Cross-validation and averaging ROC performance across folds.
Handling class imbalance with resampling or weighting.
Reporting standards in financial modeling and regulatory compliance.
End-to-End Example in R
Full script: data simulation → model training → ROC/AUC computation → ROC plots → threshold selection.
Clear visualization of model comparison and interpretation in a financial analysis context.
Conclusion and Next Steps
Recap of ROC and AUC as tools for model evaluation in finance.
Importance of aligning model choice with economic costs.
Future directions: calibration plots, Precision-Recall curves, cost-sensitive ROC analysis.
Introduction
In financial analysis, predictive models play a crucial role in credit risk scoring, fraud detection, anti-money laundering efforts, and customer segmentation. Each decision driven by these models has direct financial consequences. For example, misclassifying a high-risk borrower as low-risk may lead to defaults, while misclassifying a low-risk borrower as high-risk may result in lost revenue from rejecting a profitable client. This dual nature of risk makes evaluation metrics extremely important.
Traditional accuracy is not sufficient in these contexts because financial data are often imbalanced and costs of false positives and false negatives differ. Receiver Operating Characteristic (ROC) curves and the Area Under the Curve (AUC) provide robust tools for evaluating classifiers, enabling analysts to understand the trade-offs between sensitivity and specificity across thresholds. This article provides a detailed discussion of ROC curves, their use in finance, and a complete end-to-end example in R using a simulated dataset.
Understanding ROC Curves
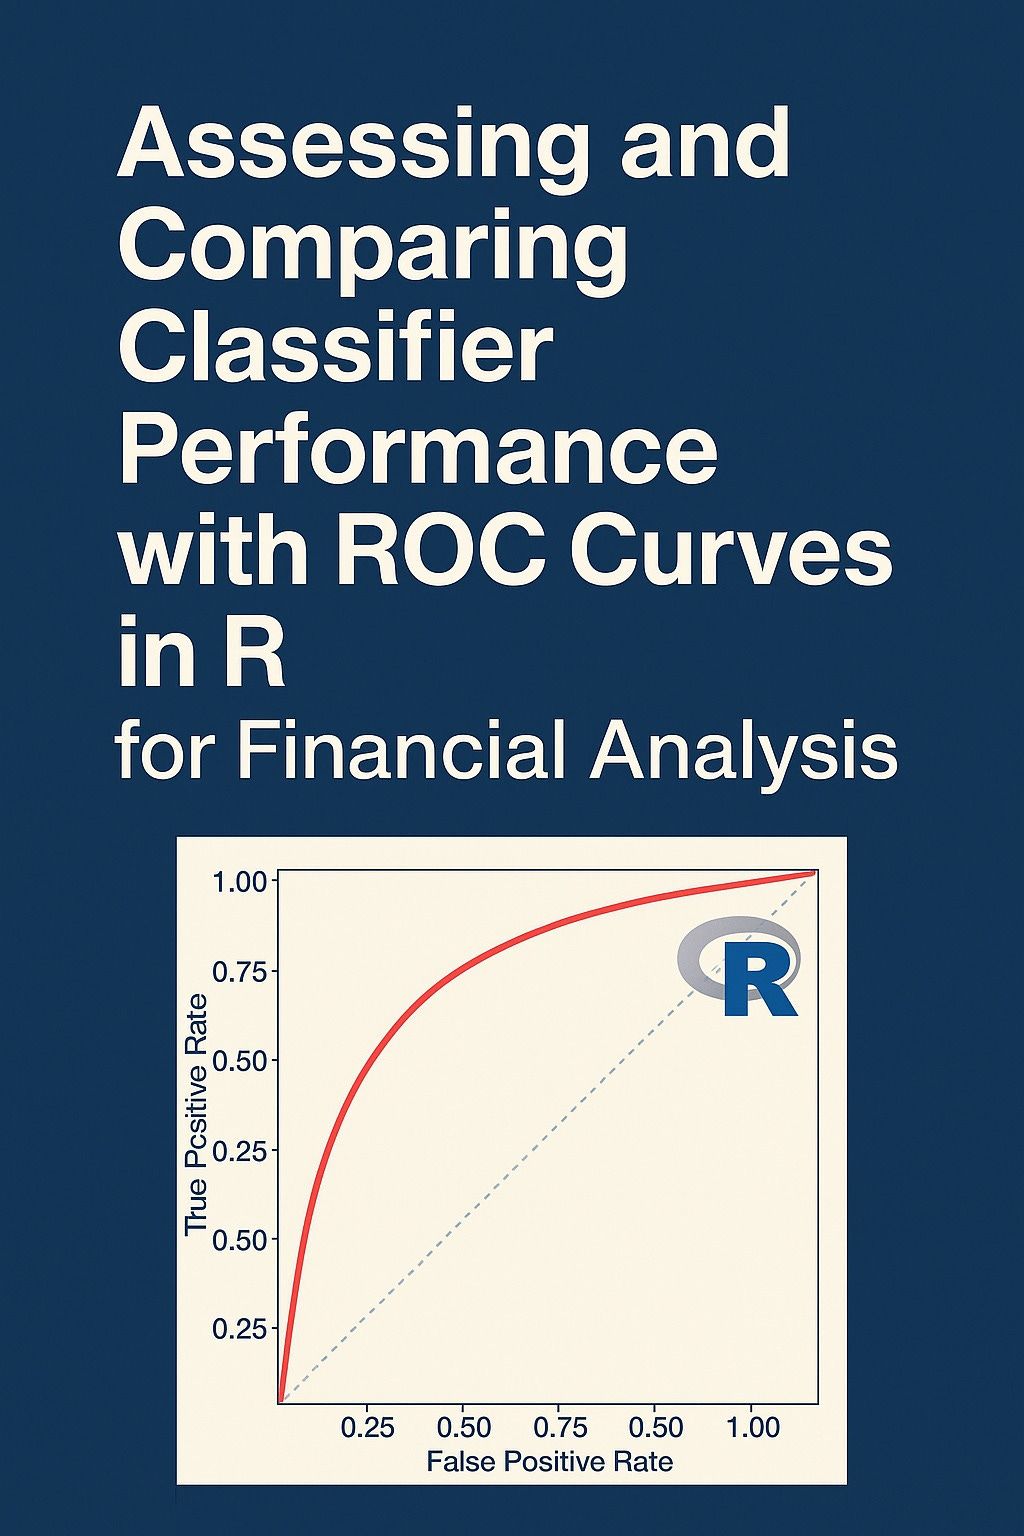
The ROC curve plots the True Positive Rate (TPR) against the False Positive Rate (FPR) for a classifier across all possible thresholds.
True Positive Rate (TPR) or sensitivity is the proportion of actual positives correctly identified. In financial analysis, this could represent the proportion of defaulting borrowers correctly classified as risky.
False Positive Rate (FPR) is the proportion of actual negatives incorrectly classified as positive. In our example, this means labeling non-defaulting borrowers as risky.
As the decision threshold varies, TPR and FPR change, creating a curve that allows visualization of the classifier’s performance. A random classifier would produce a diagonal line from (0,0) to (1,1), while a good classifier bows toward the top-left corner, showing high sensitivity with low false positives.
Keep reading with a 7-day free trial
Subscribe to AI, Analytics & Data Science: Towards Analytics Specialist to keep reading this post and get 7 days of free access to the full post archives.