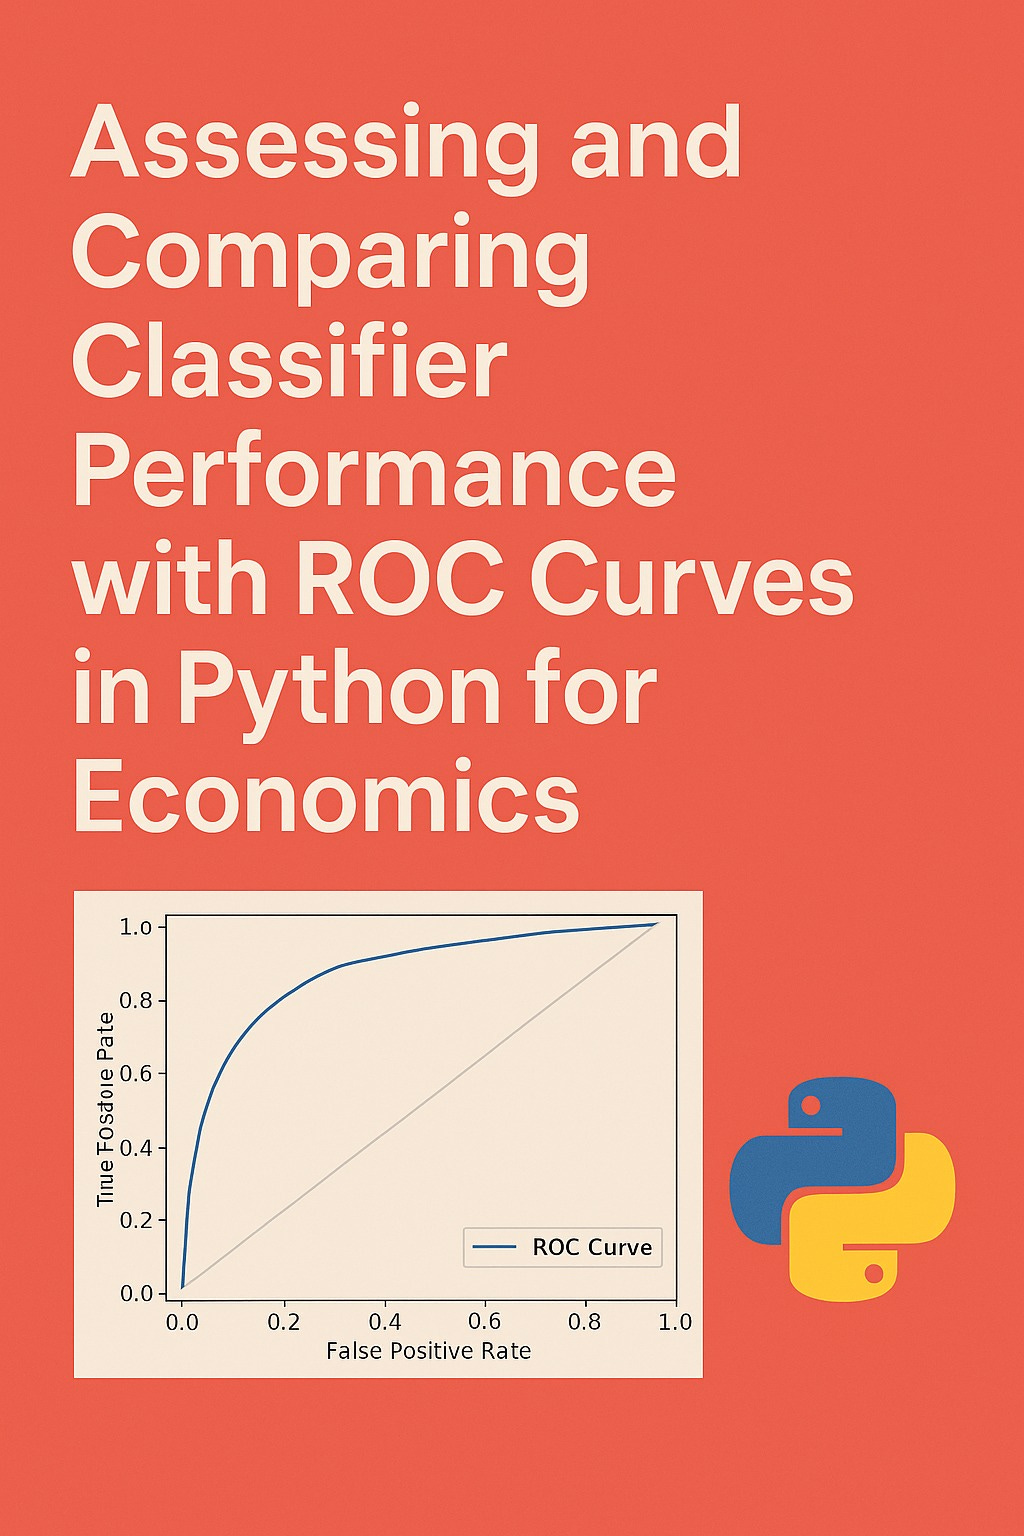
Assessing and Comparing Classifier Performance with ROC Curves in Python for Economics
This article demonstrates how economists can use ROC curves and AUC in Python to evaluate and compare classifiers, ensuring that model selection accounts for both predictive accuracy and the economic costs of false positives and false negatives.
Article Outline
Introduction
Why evaluating classifiers matters in applied economics.
Typical use cases in economics: credit scoring, default prediction, policy evaluation, fraud detection.
Why ROC curves provide insights beyond simple accuracy.
ROC Curve Fundamentals
Explanation of True Positive Rate (TPR) and False Positive Rate (FPR).
How classification thresholds affect economic decision-making.
Intuition behind the ROC space and what different shapes imply for economists.
Understanding AUC (Area Under the ROC Curve)
Definition of AUC and its interpretation as a probability measure.
How AUC summarizes model discriminative ability across all thresholds.
Why AUC is critical in economics, especially in contexts like credit risk modeling and cost-benefit policy trade-offs.
Setting Up the Python Environment
Libraries needed:
scikit-learn,numpy,matplotlib,seaborn.Why Python is suitable for economists dealing with large datasets and machine learning models.
Data Preparation in Economic Contexts
Constructing a dataset mimicking economic problems (e.g., predicting loan default vs. repayment).
Train-test split and importance of avoiding data leakage in economic research.
Training Multiple Classifiers in Python
Logistic Regression for interpretability in economics.
Random Forest as a non-linear, flexible model for economic forecasting.
Support Vector Machines as a robust method for handling complex decision boundaries.
Plotting ROC Curves for Economic Classifiers
Using
roc_curveandroc_auc_scorefrom scikit-learn.Plotting multiple ROC curves on one graph for side-by-side comparison.
Adding AUC values to the plot for clear interpretation.
Comparing Classifiers Using ROC and AUC in Economics
Interpreting ROC curves in terms of policy trade-offs (e.g., minimizing false negatives in welfare fraud detection).
Choosing models based on both AUC and domain-specific costs.
Practical examples: a policymaker deciding between maximizing recall (catching all defaulters) vs. minimizing false positives (denying loans unfairly).
End-to-End Python Example
Step-by-step: data generation → training classifiers → computing probabilities → plotting ROC curves → calculating AUC.
Producing clear and reproducible economic insights from the analysis.
Common Pitfalls and Best Practices
Misleading ROC curves in highly imbalanced datasets common in economics (e.g., rare defaults).
When Precision-Recall curves may be better.
Importance of aligning ROC/AUC insights with economic theory and stakeholder objectives.
Conclusion
Recap of ROC and AUC as tools for rigorous classifier evaluation.
Why economists should incorporate ROC analysis in empirical work.
Pathways for extending this to more advanced techniques like cost-sensitive ROC analysis and Precision-Recall trade-offs.
Introduction
In economics, predictive models are increasingly being applied to practical and high-stakes problems such as credit scoring, predicting loan defaults, fraud detection, and evaluating policy interventions. When economists deploy classifiers, the evaluation of model performance becomes crucial. While accuracy is a commonly cited metric, it often fails to capture the subtleties of model behavior, especially when the costs of misclassification are asymmetric, such as when denying credit to a reliable borrower versus granting it to a high-risk one. Receiver Operating Characteristic (ROC) curves provide a more informative framework for assessing classifier performance, enabling economists to visualize the trade-off between sensitivity and specificity across decision thresholds.
This article provides a detailed and expanded explanation of ROC curves and the Area Under the Curve (AUC), their interpretation, and their applications in economic research. Using Python, we will walk through an end-to-end example where we simulate an economic dataset mimicking loan repayment outcomes, train multiple classifiers, and compare their ROC curves. By the end, the reader will have both theoretical insights and practical tools to incorporate ROC analysis into economic modeling workflows.
Keep reading with a 7-day free trial
Subscribe to AI, Analytics & Data Science: Towards Analytics Specialist to keep reading this post and get 7 days of free access to the full post archives.


