
Interactive Multinomial Logistic Regression Shiny App for Economic Regime Classification in R

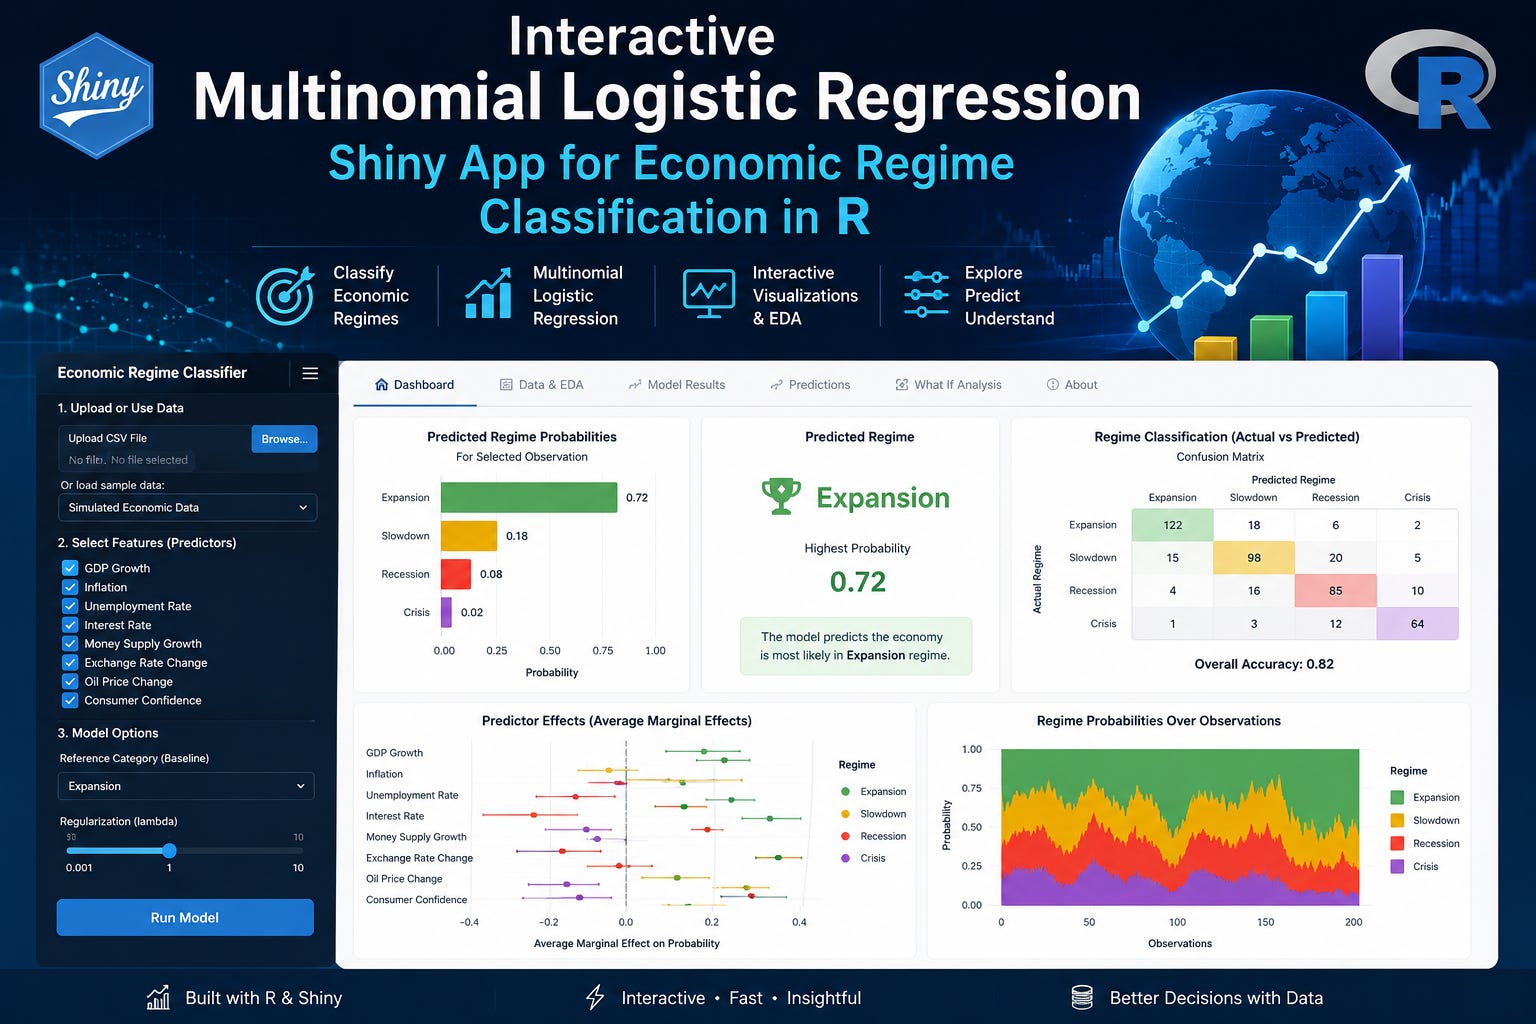
This Shiny app is a complete interactive framework for exploring multinomial logistic regression in an economics setting using three simulated macroeconomic case studies: Business Cycle Regime, Inflation State, and Credit Conditions. It is designed as both a teaching tool and an experimentation platform, allowing users to simulate macroeconomic time series, engineer lagged predictors, fit multinomial classification models, and evaluate results through a rich set of visual and numerical diagnostics. The user can choose the case study, set the sample size, adjust the seed, control the train-test split, and tune how many features appear in the exploratory plots.
At its core, the app generates synthetic macroeconomic data that mimic key variables such as the output gap, unemployment, inflation, policy rate, yield curve slope, credit spreads, and equity returns. It then transforms these simulated series into different target outcomes depending on the selected case: recession/slowdown/expansion for the business cycle, low/target/high for inflation, and tight/neutral/loose for credit conditions. To make the model economically realistic, the app uses lagged macro variables as predictors, applies a time-based train/test split rather than a random split, and standardises predictors using only the training sample before fitting the multinomial logistic regression model. This setup reflects a more appropriate forecasting workflow for time-ordered economic data.
The app contains a strong exploratory data analysis layer. Users can inspect class balance, histograms, boxplots, correlation heatmaps, and a PCA-based 2D projection of the selected predictors. These visuals help explain how the classes differ, whether predictors are correlated, and whether the macroeconomic states show natural separation in reduced-dimensional feature space. Because the number of displayed EDA features can be controlled interactively, the app is flexible enough for both quick demonstrations and more detailed inspection.
A major strength of the app is its broad diagnostic and evaluation toolkit for multiclass classification. After fitting the model, the summary tab reports class proportions, accuracy, kappa, and per-class statistics from the confusion matrix. The diagnostics section expands this with a confusion matrix heatmap, one-vs-rest ROC curves, predicted probability density plots, a coefficient heatmap for interpreting class-specific effects, and a rolling accuracy chart that shows how predictive performance evolves over time. These outputs make the app especially useful for teaching the difference between overall classification performance, class-specific discrimination, model interpretability, and time-varying stability.
Finally, the app includes practical export features through download buttons for both the simulated modelling dataset and the out-of-sample predictions with class probabilities. That makes it easy to use the app not just for on-screen demonstration but also for further offline analysis, reporting, or classroom exercises. Overall, this Shiny application provides an end-to-end, visually rich, and conceptually structured environment for learning how multinomial logistic regression can be used to classify economic states in R.
Become a paid subscriber to access the Analytics Case Studies: complete Python and R scripts, downloadable PDFs, simulated datasets, Shiny app source code, model diagnostics, portfolio projects, and full end-to-end applied analytics workflows.
