
Linear Regression in Economics Using Excel: A Step-by-Step Guide with Simulated Data

This article provides a practical guide to applying linear regression in economic analysis using Excel, with a complete end-to-end example based on simulated income and consumption data.
Download all articles from: Mini Recipes on Advanced Data Analysis & Machine learning using Python, R, SQL, VBA and Excel
Introduction
Linear regression is a fundamental tool in economics used to model relationships between variables. Economists often rely on regression techniques to understand how changes in one variable affect another—such as how income impacts consumption, or how interest rates influence investment.
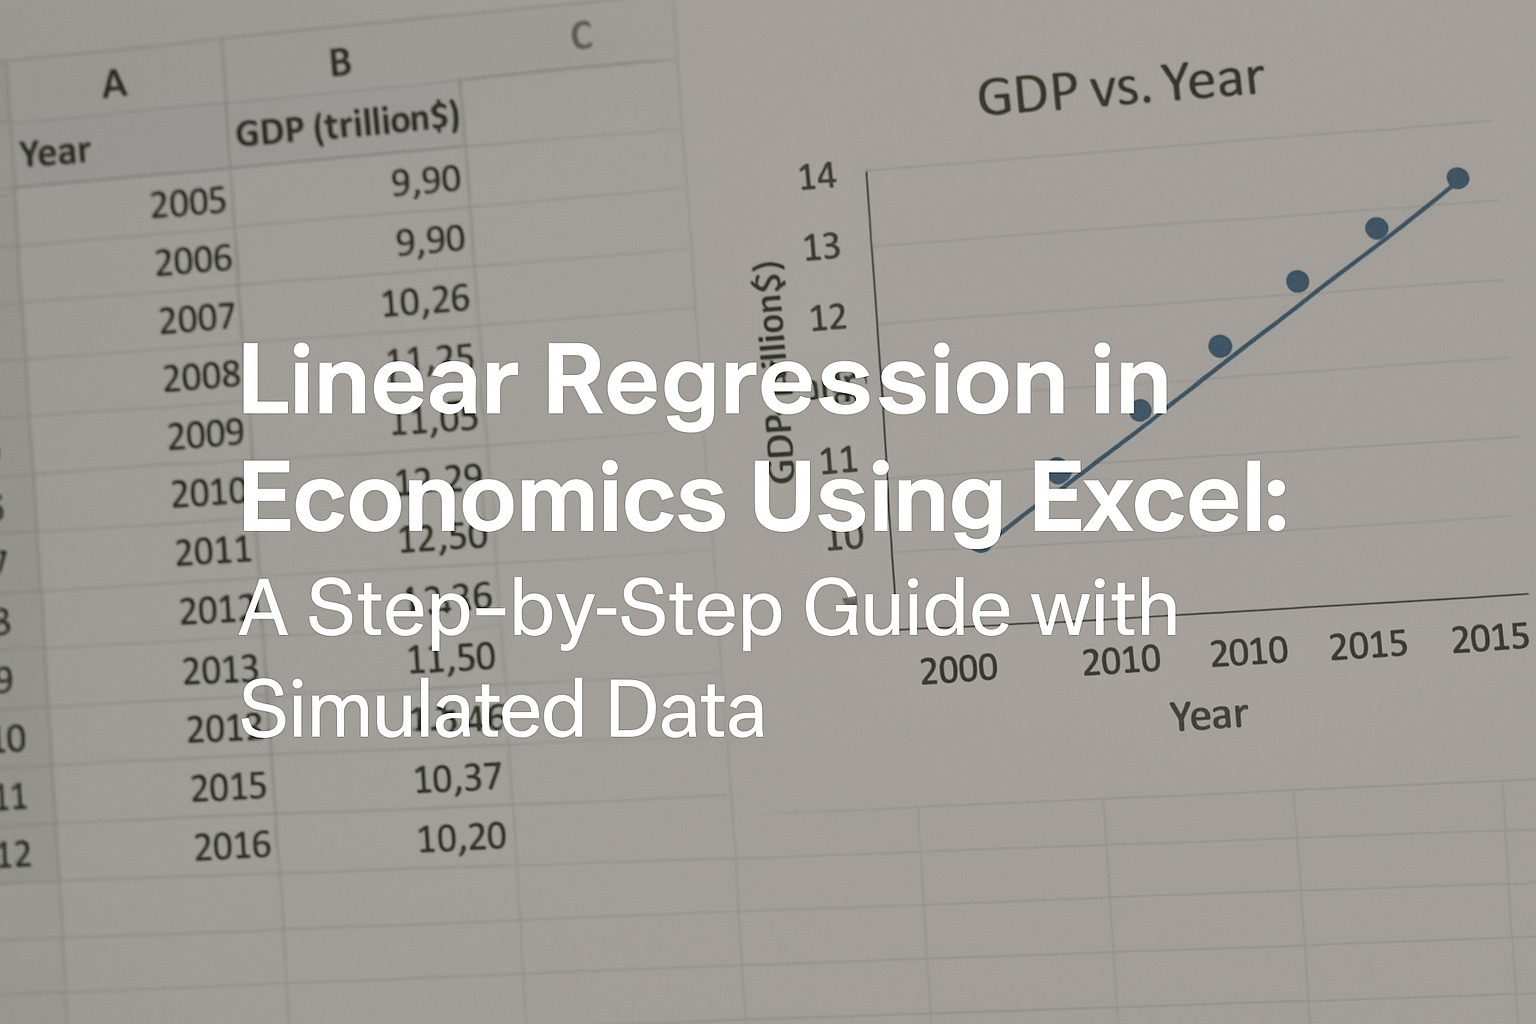
In this article, we demonstrate how to perform linear regression in Excel using a complete end-to-end example. We'll use simulated data to illustrate a common economic relationship: income versus consumption. Whether you're a student, analyst, or policy planner, Excel offers a practical way to apply regression techniques for economic insights.
Understanding Linear Regression in Economic Context
Linear regression estimates the relationship between a dependent variable and one or more independent variables. In economics, this might include:
Consumption (dependent) vs. Income (independent)
Investment vs. Interest Rate
Demand vs. Price
Inflation vs. Unemployment
The general form is:
Y = a + bX + e
Where:
Yis the dependent variable (e.g., consumption)Xis the independent variable (e.g., income)ais the interceptbis the slope (change in Y for a unit change in X)eis the error term
Keep reading with a 7-day free trial
Subscribe to AI, Analytics & Data Science: Towards Analytics Specialist to keep reading this post and get 7 days of free access to the full post archives.