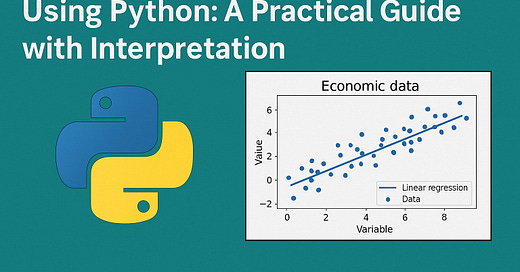
Linear Regression in Economics Using Python: A Practical Guide with Interpretation
This article explores how linear regression in Python can be used to uncover and interpret meaningful economic relationships, enhancing analytical skills and understanding of causal dynamics in economic data.
Download all articles from: Mini Recipes on Advanced Data Analysis & Machine learning using Python, R, SQL, VBA and Excel
1. Introduction
Linear regression is one of the most fundamental and widely used techniques in economics. From analyzing the impact of GDP on consumption to exploring the relationship between interest rates and inflation, linear regression helps economists quantify associations and draw meaningful insights. Python, with its rich ecosystem of data analysis libraries, provides an ideal environment to build, test, and interpret such models.
2. Understanding Linear Regression in Economic Terms
Linear regression models the relationship between a dependent variable (Y) and one or more independent variables (X) using the form:
Y = β0 + β1 * X + ε
Where:
Y: Dependent variable (e.g., consumer spending)
X: Independent variable (e.g., GDP)
β0: Intercept
β1: Slope (change in Y per unit change in X)
ε: Error term
Common economic applications include:
Modeling consumption as a function of income
Predicting inflation based on interest rates
Estimating labor market outcomes from education levels
3. Setting Up the Python Environment for Economic Analysis
To begin, make sure you have the following Python libraries installed:
pip install numpy pandas matplotlib scikit-learn statsmodels
We'll use:
NumPy for numerical operations
pandas for data manipulation
matplotlib for visualization
scikit-learn and statsmodels for regression analysis
4. Simulating an Economic Scenario
We will simulate a basic relationship where consumer spending (Y) is driven by GDP (X).
import numpy as np
import pandas as pd
import matplotlib.pyplot as plt

# Set random seed for reproducibility
np.random.seed(42)

# Simulate GDP (X) values
gdp = np.random.uniform(500, 600, 100)

# Simulate Spending (Y) values with some noise
epsilon = np.random.normal(0, 10, 100)
spending = 100 + 0.8 * gdp + epsilon

# Create a DataFrame
data = pd.DataFrame({"GDP": gdp, "Spending": spending})
Keep reading with a 7-day free trial
Subscribe to AI, Analytics & Data Science: Towards Analytics Specialist to keep reading this post and get 7 days of free access to the full post archives.


