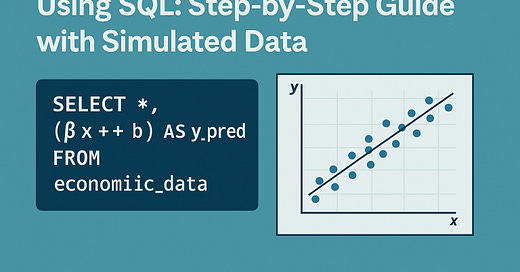
This guide demonstrates how SQL can be used to understand and quantify economic relationships through linear regression, offering practical insights into modeling, interpretation, and evaluation within a database environment.
Download all articles from: Mini Recipes on Advanced Data Analysis & Machine learning using Python, R, SQL, VBA and Excel
1. Introduction
Linear regression is a powerful statistical technique widely used in economics to identify relationships between variables such as income and consumption, inflation and interest rates, or GDP and public spending. While tools like R or Python are typically used for regression modeling, SQL can be a surprisingly effective option for data stored in relational databases. This article demonstrates how to simulate economic data and perform a full linear regression analysis using only SQL.
2. Understanding Linear Regression in Economic Analysis
Linear regression attempts to model the relationship between a dependent variable (Y) and an independent variable (X) using the formula:
Y = β0 + β1 * X + ε
Where:
Y: Dependent variable (e.g., consumer spending)
X: Independent variable (e.g., GDP)
β0: Intercept
β1: Slope (effect of X on Y)
ε: Error term
Economists use this to test hypotheses and make forecasts, such as how changes in GDP affect consumer behavior.
Keep reading with a 7-day free trial
Subscribe to AI, Analytics & Data Science: Towards Analytics Specialist to keep reading this post and get 7 days of free access to the full post archives.


