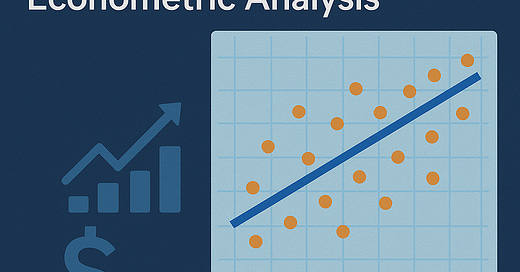
Linear Regression in Finance and Macroeconomics Using R: A Step-by-Step Guide for Econometric Analysis
This article provides a complete guide to using R for linear regression in finance and macroeconomics, empowering analysts to build, interpret, and forecast economic relationships using reliable, reproducible statistical methods.
Introduction
In finance and macroeconomics, data-driven analysis is indispensable for understanding trends, evaluating policy impacts, and making informed decisions. Among the statistical tools used, linear regression stands as a cornerstone method due to its simplicity, interpretability, and versatility. Whether assessing how investment influences GDP growth or determining the sensitivity of asset prices to interest rates, linear regression models offer a structured way to quantify relationships between variables.
R, a leading language for statistical computing, provides an intuitive and powerful platform for performing regression analysis. Its rich ecosystem of packages like tidyverse, broom, and ggplot2 makes it ideal for economists and financial analysts seeking robust, reproducible results.
This comprehensive guide walks you through the application of linear regression in the context of finance and macroeconomics using R. We'll model GDP growth as a function of investment, interpret the regression results, perform forecasting, visualize outputs, and explore extensions to more complex models.
Keep reading with a 7-day free trial
Subscribe to AI, Analytics & Data Science: Towards Analytics Specialist to keep reading this post and get 7 days of free access to the full post archives.


