


Multiple Linear Regression for Economic Analysis Using VBA in Excel: A Step-by-Step Automation Guide

This article provides a comprehensive workflow for automating multiple linear regression in Excel using VBA to analyse complex economic relationships, empowering economists and analysts to interpret, forecast, and visualize data-driven insights for informed economic decision-making.
Article Outline:
Introduction
The importance of quantitative modeling for economic decision-making
Why multiple linear regression is a core technique in economic analysis
The power and accessibility of automating regression with VBA in Excel
Understanding Multiple Linear Regression in Economics
Definition and general formula for multiple regression
Key terms: coefficients, intercept, residuals, R², and adjusted R²
Typical applications:
Explaining GDP with investment, consumption, and government spending
Modeling wage levels with education and experience
Analyzing inflation with interest rates, money supply, and unemployment
Structuring Economic Data in Excel
Recommended worksheet layout: columns for dependent and multiple independent variables
Data validation, cleaning, and preparation for regression analysis
Tips for organizing time series or cross-sectional economic data
Implementing Multiple Linear Regression in VBA
Step-by-step creation of a VBA macro to calculate regression coefficients
Using the matrix approach (normal equations) for multivariate regression
Computing predicted values, residuals, and R² within VBA
Outputting results clearly in the worksheet for interpretation
Applying the Model to Economic Scenarios
Interpreting coefficients in economic terms
Using the regression equation for scenario analysis and forecasting
Assessing model fit with R² and adjusted R², and checking for multicollinearity
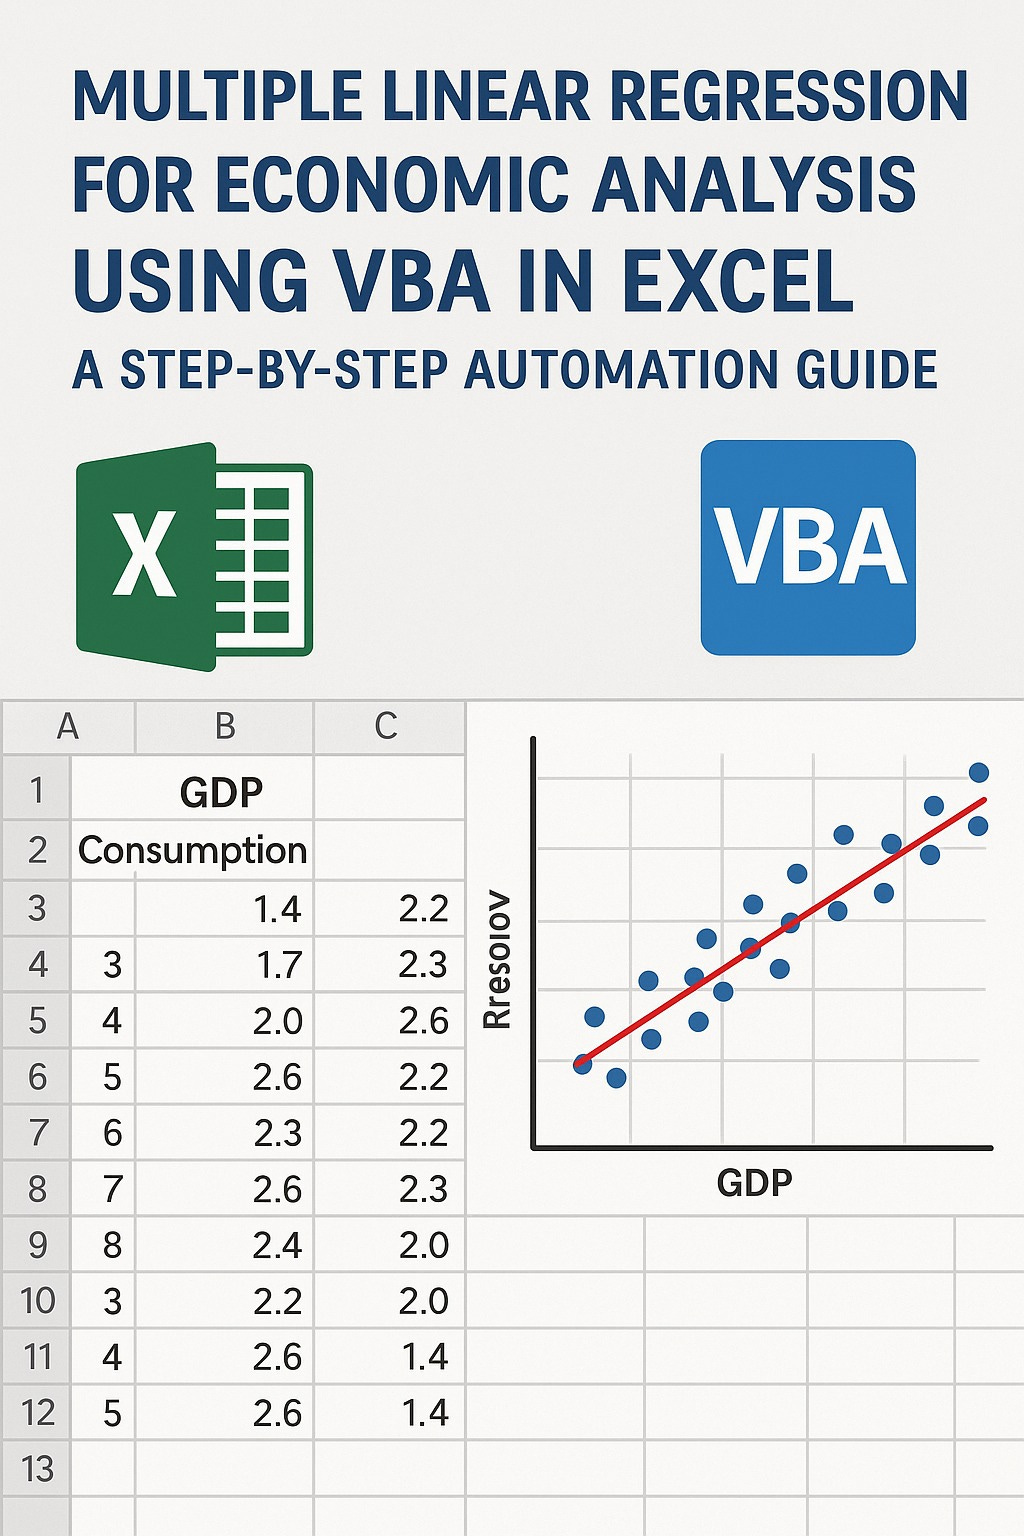
Visualizing Results and Diagnostics in Excel
Automating scatter plots, residual plots, and actual vs. predicted charts with VBA
Adding regression equations and R² to graphs
Creating clear, reproducible visuals for reports and presentations
Best Practices, Limitations, and Extensions
Regression assumptions (linearity, independence, homoscedasticity, multicollinearity)
Handling model limitations in economic time series and cross-sectional data
Extending VBA macros for variable selection, diagnostics, or integration with external tools
Conclusion
Recap of the value of automating multiple linear regression for economics with VBA
The benefits of transparency, reproducibility, and scenario testing in Excel
Next steps: enhancing VBA models, incorporating advanced econometric techniques, and connecting with other analytics platforms
Subscribe to download the full article …
Keep reading with a 7-day free trial
Subscribe to AI, Analytics & Data Science: Towards Analytics Specialist to keep reading this post and get 7 days of free access to the full post archives.